Yes, exercise can raise blood sugar. Short, intense efforts like sprints, heavy lifting or a competitive match often push it up first, because stress hormones release stored glucose into the bloodstream faster than working muscle can use it. At the same time, most steady aerobic exercise lowers glucose. If you live with type 1 or type 2 diabetes and wear a continuous glucose monitor (CGM), or you follow someone else’s data as a caregiver, the difference matters: it changes how you read a sudden high, how you watch for lows during and after activity, and what you bring to your healthcare team.
A CGM shows both patterns close to real time. Steady movement like walking, easy cycling or swimming usually bends the line down within the first 10 to 20 minutes and can keep it lower for hours afterward, while all-out work may send it up first and let it fall later. Below: what each kind of session does to the trace, how a daily walk shows up, and when to check the trend arrow.
The short version, before the detail:
- Easy to moderate cardio usually drops glucose steadily. In the largest real-world study of adults with type 1 diabetes, an aerobic session lowered glucose by 18 mg/dL on average, with a wide spread.
- Short, hard efforts can push glucose up during the session and for a while after, then let it fall later.
- Improved insulin sensitivity after exercise can last 24 hours or more.
- A daily walk shows up on a CGM mostly as flatter post-meal curves.
- The trend arrow before you start matters more than the number alone.
On this page
How fast does exercise lower blood sugar?
On a CGM, moderate aerobic exercise commonly starts bending the line down within the first 10 to 20 minutes, and by the end of a session the fall can be substantial. In the T1DEXI study of 497 adults with type 1 diabetes doing structured sessions at home, glucose dropped an average of 18 mg/dL (1.0 mmol/L) across an aerobic session and 14 mg/dL (0.8 mmol/L) across an interval session, with a wide spread around both averages. That spread is the point. Your own rate depends on how much insulin is active, what you ate, how hard you are working and how long you go.
Two things happen at once. Working muscle pulls glucose out of the blood using pathways that do not need much insulin, and if you use insulin, the insulin already on board keeps doing its own job. Muscle contraction increases glucose uptake independently of insulin, which is a large part of why activity lowers blood sugar in both type 1 and type 2 diabetes. The NIDDK describes physical activity as one of the core levers on glucose alongside food and medication.
One CGM quirk belongs here too. Sensor glucose sits in interstitial fluid, so it trails blood, and during a fast drop that lag matters. In one study of adults with type 1 diabetes doing 60 minutes of aerobic exercise, the drop on the CGM trailed the drop on a finger-stick meter by 12 minutes on average, and sensor error rose during the session. The arrow may still look mild while your actual blood glucose is already lower, which is why the authors say to confirm with a finger stick if you suspect a low mid-workout. We wrote more about that gap in why your CGM reading differs from a finger stick.
Why blood sugar sometimes rises during high intensity exercise
High intensity exercise can raise glucose because adrenaline and cortisol tell the liver to release glucose from its stores into the bloodstream, and during short maximal work that release can outrun what your muscles take up. So the graph climbs during the session. Then it often falls an hour or two later, once the hormones fade and the muscle refilling begins.
Activities that tend to push glucose up on a sensor trace:
- Heavy resistance training with low reps and long rests
- Sprints, intervals and high intensity interval training classes
- Competitive sport where nerves are part of the picture
- Anything done while already stressed, underslept or fighting an infection
This surprises people. Someone finishes a lifting session, sees a rise, and assumes the sensor is wrong. Usually the sensor is fine. The physiology is just doing something different from what a treadmill does. It is also the exception rather than the rule: in T1DEXI, even interval and resistance sessions ended lower on average (14 and 9 mg/dL), so the rise belongs to the short, all-out end of the spectrum and to the person doing it.
The practical read: intensity and duration decide direction more than exercise type does. A 45 minute steady bike ride and 12 minutes of all-out intervals are not the same input, even though both are “cardio.” Want to know which pattern is yours? Look at four or five sessions of the same workout in your CGM history rather than judging from one.
A rise during the session also says nothing about the longer run. In a small McMaster University study, eight adults with type 2 diabetes did six short high intensity interval sessions over two weeks, and their average 24 hour glucose on a CGM fell from 137 to 119 mg/dL (7.6 to 6.6 mmol/L), about 13 percent. That is the kind of change a sensor makes visible, which is the point of our guide to CGM for type 2 diabetes.
How long blood sugar and insulin sensitivity stay lower after exercise
The glucose-lowering effect of a single session can last well past the session itself, because muscle keeps restocking glycogen and insulin sensitivity stays improved. The American Diabetes Association puts that window at up to 24 hours or more after a workout, and in T1DEXI time in range was higher across the 24 hours after a session than on days without one.
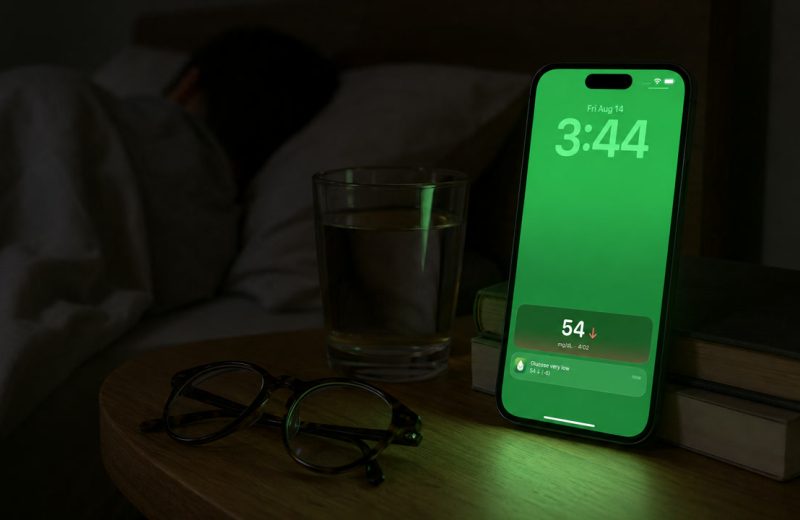
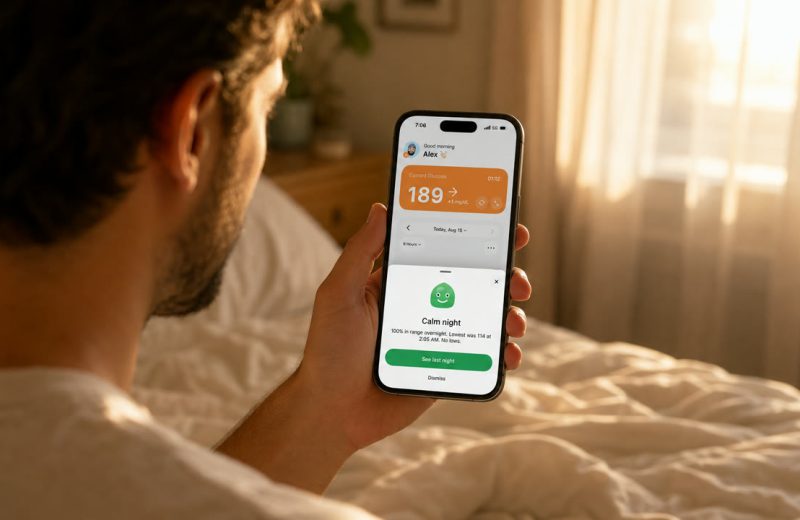
So the risk of a low is not confined to the workout. Afternoon or evening exercise can show up as a drift downward around 2 or 3 in the morning. This is my own long-running problem. Nighttime lows are the reason I wanted a second alert layer on top of my sensor’s own app, because there have been nights when one alarm did not wake me. If you train in the evening, read the overnight section of your CGM graph the next morning instead of scrolling past it.
Some patterns worth watching on your own data:
- Delayed post-intensity fall. A spike during lifting, then a slide a few hours later.
- Second-night effect. A long endurance session showing up on the following night, not just the first.
- Flat-then-drop. Glucose holds during a walk, then dips once you sit down and digestion finishes.
None of this is a reason to skip exercise. It is a reason to look at the graph afterward, and to bring the pattern to whoever manages your insulin or medication, because adjustments belong with them. The ADA’s exercise page names people on insulin, or on pills that stimulate the pancreas to release its own insulin, as the group most at risk of a low around activity, and sends exactly that question to the provider.
What a daily walking habit actually does to the graph
A daily walk rarely creates dramatic single drops. What it changes is the shape of your post-meal curves: lower peaks, earlier turns downward, less time above 180 mg/dL (10.0 mmol/L). On a CGM that reads as a calmer line and a better Time in Range number rather than one impressive dive.
Walking shortly after eating is the version with the clearest signal, because you are putting muscle uptake and food absorption in the same window. The NIDDK’s physical activity guidance for people with diabetes asks for at least 150 minutes of moderate activity a week, about 30 minutes on most days, rather than heroic single sessions. Regular, moderate activity is what moves glucose levels over time.
Here is a worked example against the standard target of 70 to 180 mg/dL (3.9 to 10.0 mmol/L) from the 2019 International Consensus on Time in Range. Say lunch normally takes you from 120 mg/dL up to a peak near 210 mg/dL, and you sit above 180 for about 70 minutes before coming back down. Add a 20 minute walk starting 15 minutes after the plate is empty, and a common result is a peak nearer 170 and no time above range at all. Repeat that five days a week and you have removed close to six hours a week of above-range time, from one meal. That is how Time in Range moves: small, boring, repeated.
To see what your own number would look like, our Time in Range calculator converts percentages into hours per day, which is a much more honest way to feel the difference.
When to check the trend arrow around a workout
Check the arrow at three moments: right before you start, once mid-session, and again 30 to 60 minutes after you stop. Direction and steepness tell you more than the single number. A reading of 110 mg/dL with a flat arrow and 110 mg/dL with a steep down arrow are two completely different situations heading into a workout.
What each check is for:
- Before. Number plus arrow plus what happened in the last couple of hours. A falling arrow before you start is information you want, and a meal from the last hour or two is still landing.
- Mid-session. One glance tells you which pattern today is: the drop pattern or the intensity rise.
- After. This is the check people skip, and it is the one that catches the delayed fall.
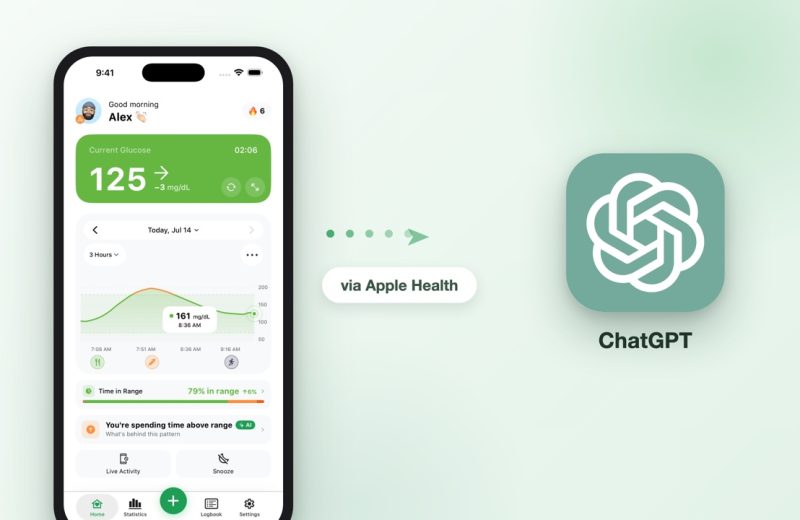
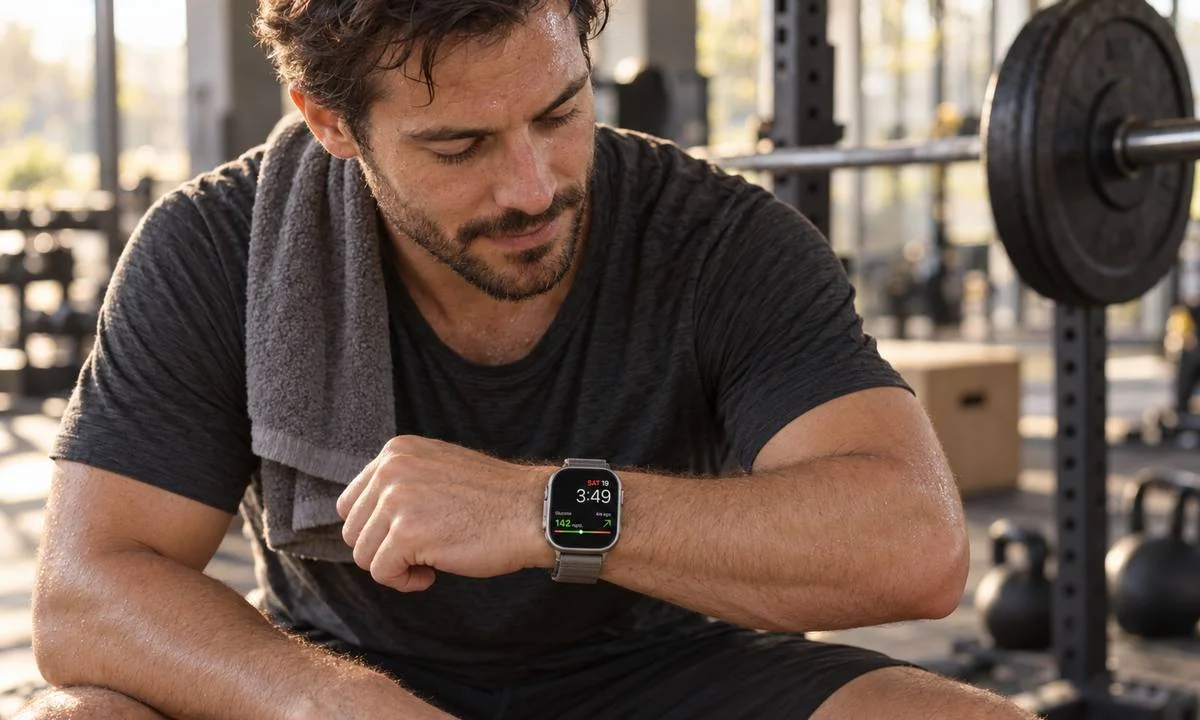
Arrow definitions differ between systems, so learn yours specifically; we broke down each symbol in what each glucose trend arrow actually means. Wrist access helps a lot here, because pulling a phone out of a locker mid-set does not happen. My glucose lives on the Modular face of my Apple Watch Ultra 2, and a glance between sets is the whole interaction. That is also the case we built Sugar Sense for: a second, independent alert layer with a predictive heading-low warning that fires while you are still in range, which matters more to me around the gym and overnight than anywhere else.
One honest personal note about lows during workouts, and it is my experience only, not advice. Lows at the gym happen to me. Fast glucose tablets lift me quickly, but the effect is short and I drift back down if I eat nothing after; a banana settles me more steadily. Fast-acting glucose is still the standard first response to a low, and what you do about lows is a conversation for your healthcare team, not a blog.
One more thing. A sensor pressed under a bench, a strap or your body weight can read falsely low. That is a compression low, and it shows up around exercise more than people expect.
Frequently asked questions
Should I exercise if my blood sugar is high?
The reason behind the high changes the answer, and that answer belongs with your clinician. Moderate activity often brings a mild high down. But exercising with very high glucose plus ketones can make things worse, which is why the American Diabetes Association says to check for ketones when glucose is above 240 mg/dL (13.3 mmol/L) and not to exercise if they are present.
Why did my CGM show a drop after I finished, not during?
Sensor glucose lags blood, by about 12 minutes on average during aerobic exercise in the study above, so the start of a fall shows up late. Meanwhile muscle keeps pulling glucose in to rebuild glycogen once you stop. Two reasons, stacked. Delayed post-exercise falls are normal and can appear hours later.
Does walking count as real exercise for blood sugar?
Large muscle groups, no equipment, easy to repeat every day: yes, walking counts, and the repetition is what actually changes glucose patterns. On a CGM the effect looks like lower meal peaks and less above-range time rather than a single steep drop.
This article is general education from someone who lives with type 1 diabetes, not personal medical guidance. Sugar Sense is a companion app: it displays data from your CGM and adds a second layer of alerts, but it never replaces your sensor, its own alarms or a finger stick when something feels off. Decisions about insulin, medication or how to train belong with your healthcare team, and our medical disclaimer spells out the rest.