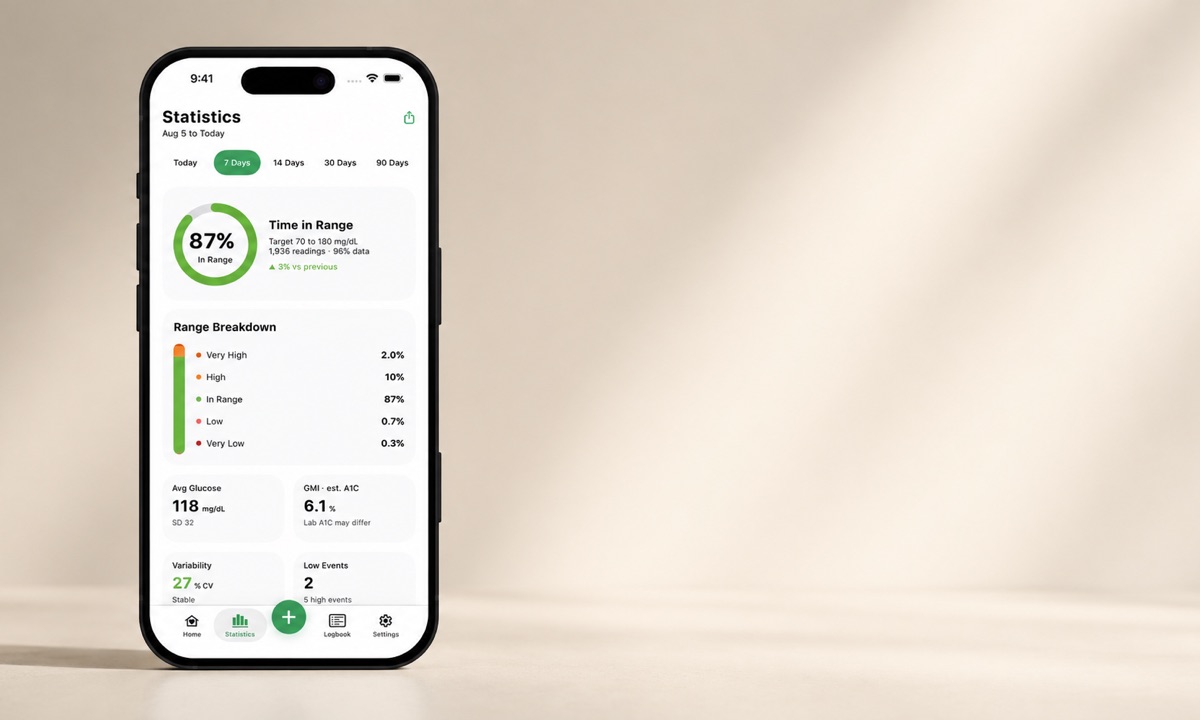
The short version: Time in Range is the share of the day your glucose spends between 70 and 180 mg/dL (3.9 to 10.0 mmol/L). The international consensus goal for most adults is above 70 percent, which is about 16 hours 48 minutes a day, with less than 4 percent of the day below range.
Time in range is the percentage of your glucose readings from a continuous glucose monitor that fall inside your target band, usually 70 to 180 mg/dL (3.9 to 10.0 mmol/L). For people with type 1 or type 2 diabetes who wear a CGM, and for caregivers following someone else’s numbers, it shows how much of the day glucose stays inside that band and gives feedback within hours instead of months of waiting for a lab result.
The percentage alone tells you very little. Two people can both sit at 70 percent and live completely different days once you split the other 30 percent into time high and time low. Lows carry the more urgent risk, which is why time in range works best next to A1C rather than instead of it. This guide explains how time in range on a CGM is calculated, what the goals are, what time in tight range means, how to read the number day to day, and how it fits with A1C and real-time alerts.
On this page
What time in range actually measures
Time in range (TIR) is the percentage of your CGM readings that land between 70 and 180 mg/dL across a chosen window, most often 14 days, 30 days or 90 days. Nothing more complicated than that.
The math is simple because the data is dense. A sensor that reports every five minutes produces about 288 readings a day, and some report every minute. Count the readings inside the band, divide by the total, done. A fingerstick gives you one dot. A CGM gives you the whole line, and that is why the metric only became practical once sensors got cheap and comfortable enough to wear all the time.
TIR almost never appears alone, and it shouldn’t:
- Time below range (TBR): percentage of time under 70 mg/dL, usually split again at 54 mg/dL for the more serious lows.
- Time above range (TAR): percentage over 180 mg/dL, often split again at 250 mg/dL.
- Glucose Management Indicator (GMI): an estimate of A1C calculated from your CGM average.
What time in range shows that A1C hides
A1C reports one number for roughly three months of average glucose, and averages flatten out everything interesting. Two people with an A1C near 7 percent can spend wildly different amounts of the day out of range: one steady, the other bouncing between 250 mg/dL and 55 mg/dL in a way that averages out neatly on paper. The same average can hide a lot of glycemic variability.
The A1C test measures the percentage of hemoglobin carrying attached glucose, as the National Institute of Diabetes and Digestive and Kidney Diseases explains, so it reflects the past two to three months rather than yesterday. That slow response is a strength for tracking the long arc. It is a weakness for changing anything this week.
Time in range moves fast. Shift something today and tomorrow’s percentage already reflects it. The 2019 International Consensus on Time in Range (Battelino et al., Diabetes Care) endorsed it as a metric to use alongside A1C, not as a replacement for it, and the American Diabetes Association Standards of Care now carry the same targets. The two metrics do track each other: a pooled analysis of 18 studies found that every 10 percent change in time in range moved A1C by about 0.8 points, and 70 percent in range lands near an A1C of 7.
The reason clinicians took the metric seriously is that it predicts harm. In the landmark DCCT data, lower time in range went with more retinopathy progression and early kidney damage, and a 2018 study of adults with type 2 diabetes found more diabetic retinopathy with each step down in time in range.
What are good time in range goals?
For most non-pregnant adults with type 1 or type 2 diabetes, the widely cited goal from that 2019 consensus is more than 70 percent of the day in the 70 to 180 mg/dL target range, with less than 4 percent below 70 mg/dL and less than 1 percent below 54 mg/dL. The full set of targets looks like this:
| Metric | Band | Consensus goal, most adults |
|---|---|---|
| Time in range | 70 to 180 mg/dL | More than 70 percent (about 17 hours) |
| Time below range | Under 70 mg/dL | Less than 4 percent (about 1 hour) |
| Time very below range | Under 54 mg/dL | Less than 1 percent (about 15 minutes) |
| Time above range | Over 180 mg/dL | Less than 25 percent (about 6 hours) |
| Time very above range | Over 250 mg/dL | Less than 5 percent (about 75 minutes) |
Those numbers are a starting frame, not a verdict on anyone. The same consensus sets looser goals for older adults and people at high risk, where more than 50 percent in range and under 1 percent below 70 mg/dL is the aim, because a bad low does more damage than a mediocre high. Pregnancy uses a tighter band entirely, 63 to 140 mg/dL.
Your own target belongs in a conversation with your healthcare team, who can weigh your history of lows, how long you have lived with diabetes, other conditions and how much warning you get before a low. Chasing 100 percent is not the goal and never was. Going from 55 percent to 65 percent is real progress worth keeping, and even 5 percent is about 72 more minutes a day inside the band.
What is time in tight range?
Time in tight range (TITR) is the newer, stricter cousin: the share of readings between 70 and 140 mg/dL, the band people without diabetes spend most of their day in. It was proposed in 2023 as an extra CGM metric, mostly for closed-loop pump research, young children and pregnancy, and it is starting to appear on some reports.
There is no consensus target for it yet, and the reviews say so plainly: the right TITR goals still have to be established. For most adults 70 to 180 remains the goal, and a high time in tight range bought with more lows is the same bad trade as before. Treat it as a second decimal place, not a new exam.
What 70 percent looks like across one real day
Seventy percent of 24 hours is 16 hours and 48 minutes inside 70 to 180 mg/dL, which leaves a little over 7 hours outside the band. Written that way, the target suddenly feels reachable.
Here is a single day, minute by minute. Overnight from midnight to 7 a.m. you sit between 95 and 125 mg/dL: seven hours in range. Breakfast pushes you to 215 mg/dL and you stay above 180 for about an hour before coming back down. Midday holds steady. A gym session in the late afternoon drops you to 65 mg/dL for roughly 25 minutes before you come back up. Dinner nudges you to 195 mg/dL for 45 minutes.
Add the excursions: 60 minutes high, 45 minutes high, 25 minutes low. That is 130 minutes outside the band, so about 21 hours and 50 minutes in range, or 91 percent. Time below range comes out near 1.7 percent, inside the under 4 percent goal. One imperfect day with two spikes and a gym low still reads as an excellent day. That is exactly the point of measuring it this way.
Reading the number without chasing it
Look at time below range before you look at time in range. A high percentage bought with frequent lows is not a win, and the NIDDK guidance on low blood glucose is blunt about why hypoglycemia deserves the first look.
My own time in range sits around 85 to 90 percent, but that is not the figure I check first. Nighttime lows have been my long-running problem, and there were nights when one alarm did not wake me, so the small number under 70 mg/dL matters more to me than the big number in the middle.
A few habits make the metric useful rather than decorative:
- Judge weeks, not days. The 2019 consensus suggests 14 days of data with sensor use around 70 percent of the time as a reasonable snapshot. One rough Tuesday means nothing.
- Find the repeating hour. A dip most afternoons or a climb most mornings is a pattern. If your mornings run high, the dawn phenomenon is worth reading about before you assume you did something wrong.
- Read the percentage next to your notes. Meals, movement and sleep explain the shape of the graph far better than the number alone.
- Let alerts do the in-the-moment work. Statistics are for review; real-time high and low alerts are what keep a drift from becoming an event.
When you spot something repeating, bring it to your care team rather than acting on it alone. Patterns are evidence, not instructions.
Does time in range replace A1C?
No. Both consensus guidance and the ADA Standards of Care treat time in range as complementary to A1C, and the lab test still anchors long-term risk assessment.
The confusing part is GMI, the A1C estimate your CGM report shows. It comes from your average sensor glucose, not from your blood, and it can sit noticeably above or below your lab result for reasons that have nothing to do with how your management is going. CGMs measure glucose in interstitial fluid just under the skin rather than directly in blood, which is one reason GMI and a lab A1C can drift apart. If the two numbers disagree, our explainer on GMI versus A1C covers why that gap is normal.
Think of it this way. A1C tells you where you have been over a season. Time in range tells you what this week actually felt like, and the two together are far more informative than either alone. If you want that split visible every day instead of every quarter, Sugar Sense keeps time in range and time below range on the same screen.
Frequently asked questions
Is 70 percent time in range good?
For most non-pregnant adults with type 1 or type 2 diabetes, yes, 70 percent is the standard goal from the 2019 international consensus and the ADA Standards of Care, and it works out to roughly 17 hours a day inside the band. Older adults and people at high risk of lows are often given a target closer to 50 percent.
Is 85 percent time in range good?
Yes, comfortably above the 70 percent goal, and the consensus sets no upper target. The check that matters at that level is the split of the other 15 percent: under 4 percent below 70 mg/dL and under 1 percent below 54 mg/dL is what keeps a high percentage honest. My own 85 to 90 sits there, and time below range is still the number I read first.
How is time in range calculated?
Your CGM counts how many readings fall between 70 and 180 mg/dL and divides that by all readings in the window. A sensor reporting every five minutes generates about 288 readings a day, so each reading represents roughly a third of a percent.
What is a normal time in range for someone without diabetes?
Very high, in a much narrower band. In a 2019 study of healthy adults wearing a CGM, the median time between 70 and 140 mg/dL was 96 percent, which is where the time in tight range idea comes from. Nobody with diabetes is measured against that. The 70 percent goal in the wider 70 to 180 band is the benchmark that applies.
Can you have a good A1C and poor time in range?
That combination is common. Heavy highs balanced by frequent lows average out to a pleasant-looking A1C while the actual days are unstable. That mismatch is one of the main reasons the consensus panel pushed for range-based metrics.
How many days of CGM data do I need?
Around 14 days with the sensor active roughly 70 percent of the time gives a reasonable estimate of your longer-term pattern, according to the 2019 consensus. Shorter windows are still useful for spotting a specific problem hour, just not for judging progress.
Does time below range count against time in range?
Every minute under 70 mg/dL is counted separately as time below range, so it reduces your in-range percentage. Review it first anyway. A lower TIR with almost no lows is usually the safer picture, and your care team can help you decide.
Written to explain a metric, not to guide treatment. Time in range is a review tool: your CGM and its own alarms stay your safety system, and a companion app like this one never stands in for them. Any change to how your diabetes is managed belongs with the clinicians who know your history, and our medical disclaimer spells out the limits of what you read here.