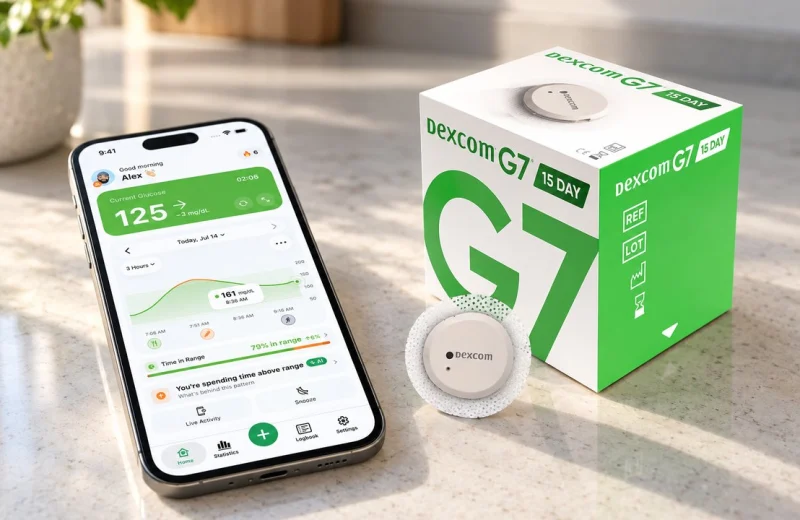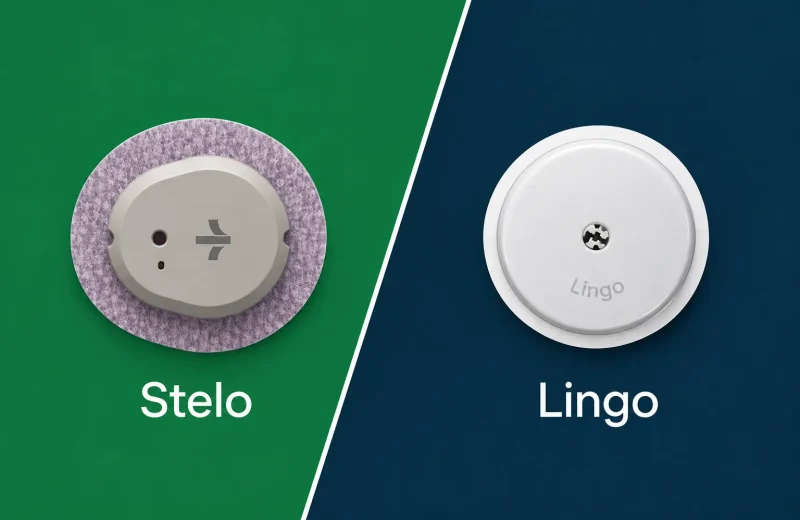
The short version: a trend arrow shows where your glucose is heading and how fast, which changes what a number means. 100 steady, 100 falling fast and 100 rising fast are three different situations, and the arrow is what tells them apart.
Short answer: Dexcom trend arrows show the direction and the speed of your glucose in seven states on a G7 (steady, slowly rising or falling, rising or falling, rapidly rising or falling), and Dexcom defines each one by how much glucose would change in 30 minutes. FreeStyle Libre uses five states with its own cutoffs. The chart below has both brands, in mg/dL and mmol/L per minute, plus what a double arrow means and why an arrow sometimes goes missing.
Glucose trend arrows show two things at once: how fast your glucose is moving, and which way. Flat means you are changing by less than 1 mg/dL per minute. Diagonal is roughly 1 to 2. Vertical is faster than that.
The catch is that an arrow is computed from the last few readings and, in the manufacturers’ own framing, tells you about the next 15 to 30 minutes, not the next hour. Dexcom and Abbott also draw the cutoffs differently, so the same arrow shape on two brands is not the same event.
Arrow first: 150 mg/dL (8.3 mmol/L) with a flat arrow and 150 mg/dL with a vertical down arrow are two completely different situations, and the number alone cannot tell them apart. Arrows describe speed; what you do about that speed is a conversation for you and your healthcare team.
On this page
What each of the five arrow directions means
Every CGM display uses the same five directions: straight up, up at an angle, flat, down at an angle, and straight down. Each one covers a band of change measured in mg/dL per minute. The manufacturer sets that band. There is no shared industry standard.
- Straight up. Fast rise. On most systems this is the top band, above 2 or 3 mg/dL per minute depending on the brand.
- Up at an angle. A moderate rise, generally around 1 to 2 mg/dL per minute.
- Flat (horizontal). Under 1 mg/dL per minute of change in either direction.
- Down at an angle. A moderate fall, generally around 1 to 2 mg/dL per minute.
- Straight down. Fast fall, the mirror image of the top rising band.
Dexcom adds two more shapes on top of those five: doubled vertical arrows for the most extreme rise and fall. So a Dexcom screen can show seven states, while a FreeStyle Libre screen shows five.
What the Dexcom double arrow means
Two arrows down, or two arrows up, is Dexcom’s “rapidly falling” or “rapidly rising” state: more than 90 mg/dL of change in 30 minutes, which is over 3 mg/dL per minute. At that speed, 15 minutes is 45 mg/dL or more, so 140 with a double down arrow can be near 95 before you have finished what you were doing. Dexcom’s Falling Fast and Rising Fast alerts fire on the same 3 mg/dL per minute line. Libre has no double arrow; its single vertical arrow starts at 2 mg/dL per minute and covers everything faster.
Flat is not frozen, either. At 0.9 mg/dL per minute you are still inside the flat band, and that adds up to about 27 mg/dL over half an hour. Most of the time that drift is harmless. At 3 a.m., near the bottom of your range, it is not nothing.
Why the arrow often matters more than the number
The number tells you where you are. The arrow tells you where you are going, and 15 minutes of fast movement can be worth 30 to 45 mg/dL. That is why two identical readings can call for completely different attention. Most CGMs refresh every 1 to 5 minutes, which is the whole point of continuous monitoring compared with a single fingerstick snapshot, as the National Institute of Diabetes and Digestive and Kidney Diseases explains.
Here is one ordinary day of mine against the standard 70 to 180 mg/dL (3.9 to 10.0 mmol/L) range that the 2019 International Consensus on Time in Range uses for adults with type 1 or type 2 diabetes:
- 7:10 a.m., 132 mg/dL, flat. In range, going nowhere. Nothing to think about.
- 8:40 a.m., 168 mg/dL, up at an angle. Still in range, but at 1.5 mg/dL per minute I will be near 190 in 15 minutes. The number says fine. The arrow says wait, this is not finished.
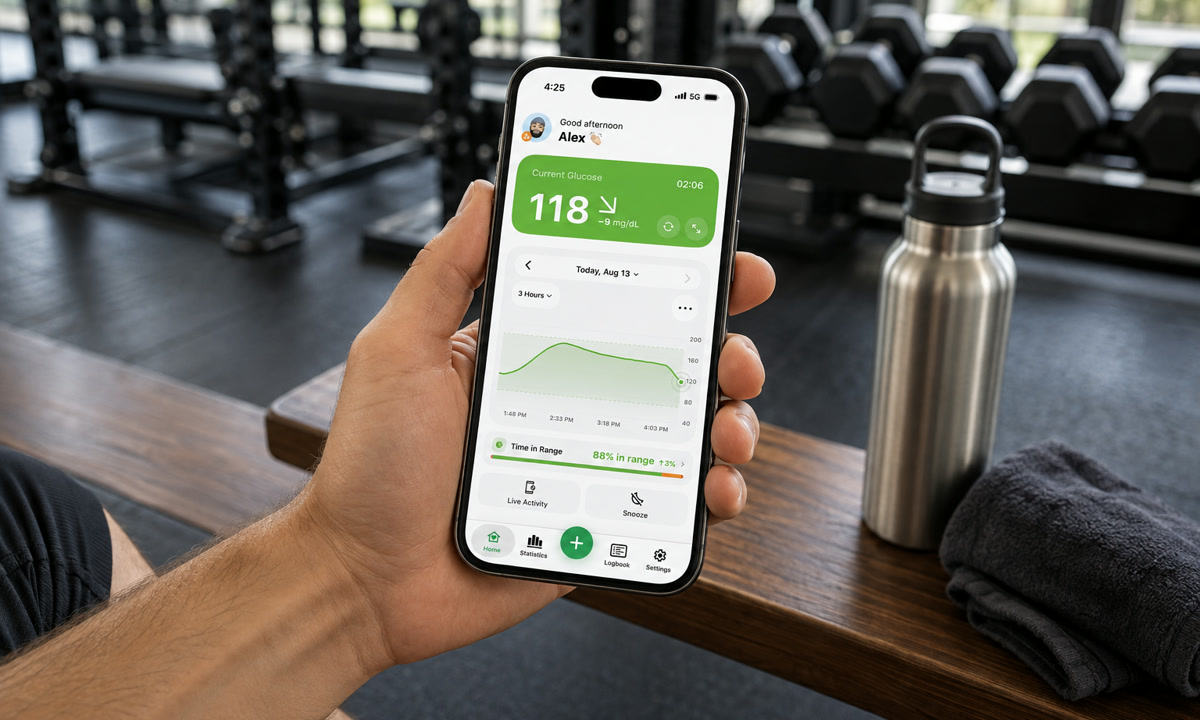
- 4:25 p.m., 118 mg/dL, down at an angle. Comfortably in range on paper. At 2 mg/dL per minute I am close to 90 within 15 minutes and knocking on 70 within 25. This is the reading that gets my attention before the gym.
- 9:50 p.m., 176 mg/dL, flat. High-ish, but stable and heading nowhere fast.
Two of those four readings sit in range with the trend doing the interesting work. My Time in Range currently sits around 85 to 90 percent, and honestly a lot of that comes from acting on arrows at 8:40 a.m. and 4:25 p.m. rather than reacting to numbers after they have already left the range. If you want the mechanics of how the sensor produces those readings in the first place, I wrote a plain-language explainer on what a continuous glucose monitor is and how it works.
How Dexcom and FreeStyle Libre arrows differ
Per the manufacturers’ own guides, Dexcom G7 splits fast movement into two arrows (2 to 3 mg/dL per minute, and more than 3) while FreeStyle Libre uses a single vertical arrow for anything above 2 mg/dL per minute. A Libre vertical arrow is therefore a wider category than a Dexcom vertical arrow, and it is not the equivalent of Dexcom’s double arrow. Dexcom states its bands as change over 30 minutes; Abbott states its bands per minute. The chart puts them side by side.
| Rate of change | Dexcom G7 (Dexcom’s 30-minute figure) | FreeStyle Libre 2 and 3 |
|---|---|---|
| Under 1 mg/dL per minute (under 0.06 mmol/L) | Steady, flat arrow: under 30 mg/dL in 30 minutes | Changing slowly, flat arrow |
| 1 to 2 mg/dL per minute (0.06 to 0.1 mmol/L) | Slowly rising or falling, diagonal: 30 to 60 mg/dL in 30 minutes | Rising or falling, diagonal |
| 2 to 3 mg/dL per minute (0.1 to 0.17 mmol/L) | Rising or falling, single vertical: 60 to 90 mg/dL in 30 minutes | Rising or falling quickly, vertical |
| Over 3 mg/dL per minute (over 0.17 mmol/L) | Rapidly rising or falling, double vertical: more than 90 mg/dL in 30 minutes | Rising or falling quickly, vertical |
Practical translation: if you switch brands, do not carry your old instincts over unchanged. I use a Libre 3 Plus most days and a Dexcom G7 from time to time, and the arrow that makes me stop what I am doing is not shaped the same on both screens. A single Dexcom down arrow already means 2 to 3 mg/dL per minute, which on Libre would be drawn straight down.
Self-hosted setups add one more wrinkle. Nightscout and third-party viewers calculate arrows from the raw readings they receive, so the cutoffs may not match the manufacturer app exactly. If you use one, treat the arrow as a good approximation rather than a certified reading. Our free CGM glossary has a short trend arrows entry you can check when a shape does not look familiar.
Why is there no arrow on my Dexcom or Libre?
A missing arrow means the system does not have enough recent, trustworthy data to calculate a rate: sensor warm-up, a lost Bluetooth connection, a scan gap on a flash-style setup, or a sensor error. The number may still show while the arrow stays blank. Dexcom’s own answer for the G7 is that the sensor “may be temporarily unable to accurately measure” the speed and direction, and that while the arrow is missing you should use a blood glucose meter for any decision (Dexcom FAQ). Once readings arrive on schedule again, the arrow comes back on its own.
Two things a blank arrow is not: it is not a sign the sensor has failed (a failed sensor stops the number too), and it is not something a companion app can fill in from older data. Sugar Sense shows the arrow it receives, and a blank stays blank until the source has a rate again.
Why your sensor and your fingerstick disagree during fast changes
A CGM measures glucose in the fluid just under your skin, not in your blood, and that fluid lags behind blood by roughly 5 to 15 minutes. During a fall of 3 mg/dL per minute, a 10 minute lag is about 30 mg/dL of honest disagreement between a sensor and a meter, with neither one broken.
This is why arrows and fingersticks argue most when the arrow is vertical and never when it is flat. When you are steady, the lag has nothing to catch up on. Move fast and the meter sees the change first, with the sensor following a few minutes later. Both Dexcom and Abbott tell users to confirm with a blood glucose meter when symptoms do not match the sensor reading. I go into the full mechanism in why your CGM reading differs from your fingerstick.
One more thing that looks like disagreement but is not: a fall that shows up while you are lying on the sensor. That is a compression low, and the arrow can look genuinely alarming for 20 minutes before it recovers on its own.
Using arrows together with your alerts
Alerts fire on thresholds. Arrows tell you a threshold is coming, and a heading-low forecast is what happens when software watches both at once. A low alert at 70 mg/dL tells you that you are already there. A vertical down arrow at 110 tells you that you probably will be in 15 minutes.
That gap is the whole reason predictive alerts exist. If you are dropping at 2.5 mg/dL per minute from 110 mg/dL, a 20 minute forecast can warn you while you are still comfortably in range and still able to think clearly. I explain how those forecasts are built in the piece on predictive low glucose alerts.
Nighttime lows have been my own long-running problem for years. There were nights when a single alarm did not wake me, and that is exactly why I wanted a second, independent layer on top of the sensor’s own app. We built the heading-low alert in Sugar Sense around that idea: warn on the trend, not only on the threshold, and let a family member see the same arrow I see.
Alarm fatigue is one of the best documented problems in CGM life. People turn alerts off, or start ignoring them, because too many fire for movement that was never going anywhere. Trend arrows are the honest fix. Learn what the diagonal arrow means for you, and you can set your thresholds a little wider without losing the warnings that actually matter.
A calm sequence that works for me, one arrow at a time:
- Look at the direction before the number.
- Do the 15 minute math in your head: diagonal is roughly 20 to 30 mg/dL, vertical is more.
- Ask what you did in the last hour that explains it, such as food, activity or a missed reading.
- If your symptoms and your arrow disagree, use a fingerstick.
- Check again in 15 minutes instead of staring at the screen. Arrows change, and stacking reactions on top of each other rarely ends well.
Frequently asked questions
Does a trend arrow tell me how much to treat?
No. An arrow reports a rate of change and nothing else; it says nothing about insulin, carbohydrate amounts or corrections. How you respond to a rising or falling trend is something to work out in advance with your diabetes care team, ideally as a written plan you can follow when you are shaky.
What does 2 arrows down mean on Dexcom?
Rapidly falling: more than 90 mg/dL in 30 minutes, over 3 mg/dL per minute. It is the fastest state Dexcom draws, and the one that deserves a fingerstick if what you feel does not match the screen.
Can I see trend arrows on my watch?
Most CGM and companion apps put the arrow right next to the number in a watch complication, which is the fastest glance you can get. On my Apple Watch Ultra 2 the arrow lives on the Modular face, and I read direction before I read the value almost without thinking about it.
What do the arrows on a glucose meter mean?
A fingerstick meter has none. It measures one drop of blood at one moment, so it cannot know a direction. Arrows exist only on systems that measure continuously, which is the sensor’s whole advantage.
This article is education, not medical advice. A companion app like Sugar Sense mirrors what your CGM already measures and never replaces your sensor, its app or its built-in alarms, so keep those switched on. Anything involving medication, treating a low or changing your targets belongs with your healthcare team, and our full disclaimer spells out the limits.