The difference between GMI and A1C comes down to source and time window. GMI (Glucose Management Indicator) is calculated from the average glucose your CGM records, usually over the last 14 days. A1C is a lab blood test that measures how much glucose has attached to your hemoglobin over roughly the past 2 to 3 months. Same question, two instruments. So they often land near each other and still rarely match exactly.
If you wear a CGM, follow a family member’s numbers, or just want to make sense of the report before an appointment, this guide covers what each number measures, why they disagree, what a good GMI looks like, how the formula turns average glucose into a percentage, and how Time in Range completes the picture.
What to hold onto before the detail:
- GMI comes from sensor data; A1C comes from a blood draw.
- GMI usually looks back 14 days, A1C looks back 2 to 3 months.
- A gap of a few tenths of a percent is normal and expected.
- A consistent gap of more than half a point is information, not an error.
- Neither number shows your highs and lows, which is why Time in Range sits beside them.
On this page
How A1C works, and where it can mislead
A1C measures the percentage of hemoglobin in your red blood cells that has glucose stuck to it. Those cells live about three months, so the result reflects your average glucose across that window. No fasting needed. The National Institute of Diabetes and Digestive and Kidney Diseases describes it as the standard test for tracking long-term glucose control, and the American Diabetes Association treats it the same way in its guidance on A1C.
The catch is that A1C assumes your red blood cells behave in an average way. Plenty of people’s do not. Things that can pull the number away from your true glucose average include:
- Anemia, recent blood loss or a recent transfusion
- Pregnancy
- Certain hemoglobin variants and conditions such as sickle cell disease, which are more common in some ethnic groups
- Kidney disease and other conditions that change how long red blood cells live
There is a second limitation, and it has nothing to do with biology. An average hides the shape of the days behind it. Two people can walk out of the lab with the same 7.0%: one spent most of the month steady and in range, the other bounced between 50 and 300 mg/dL (2.8 to 16.7 mmol/L). Identical result. Very different weeks.
What GMI is and where your CGM shows it
GMI is a percentage calculated directly from your mean sensor glucose over a set period, typically 14 days. It exists so CGM users can see an A1C-style figure without waiting for a lab visit. The term was introduced in 2018 by Bergenstal and colleagues in Diabetes Care, replacing the older label “estimated A1C” because that phrasing suggested more precision than the calculation can deliver.
The published formula is GMI (%) = 3.31 + 0.02392 × your average glucose in mg/dL, derived by Bergenstal and colleagues in Diabetes Care (2018). In IFCC units the same relationship is GMI (mmol/mol) = 12.71 + 4.70587 × average glucose in mmol/L.
Higher average sensor glucose, higher GMI. That is the whole engine, and the exact formula and a chart are a little further down. In the United States it appears as a percentage (6.8%, for example), and reports elsewhere may show it in mmol/mol alongside your average glucose.
You will usually find GMI on the summary page of your CGM report, next to average glucose and Time in Range, in both manufacturer apps and clinic software. Two things decide whether that figure means much: how many days it covers, and how complete those days were. The usual working standard is at least 14 days of wear with the sensor actually reading about 70% of the time or more. If yours warmed up repeatedly, sat unread for hours or fell off midweek, the number still gets printed on the report. It is just describing a thinner slice of your life than it looks like. If you are new to how sensors produce these figures, our explainer on how a continuous glucose monitor works covers the mechanics.
What is a good GMI?
GMI sits on the A1C scale on purpose, so people read it against the same landmarks. On a lab A1C the American Diabetes Association calls under 5.7 percent normal, 5.7 to 6.4 the prediabetes band, and 6.5 or higher the diagnostic threshold; for most non-pregnant adults who already have diabetes, its general A1C goal is under 7 percent, with looser goals for older adults and anyone at high risk of lows. GMI borrows those numbers as a guide, with one hard limit: GMI is never used to diagnose anything, and your own target is set with your care team.
| GMI | What your care team will usually read into it |
|---|---|
| Under 5.7 | The range labs associate with people without diabetes. On a CGM report it usually means a very low average; check time below range before celebrating. |
| 5.7 to 6.4 | Well under the general 7 percent goal. For someone with diabetes, a strong fortnight, provided lows are under control. |
| 6.5 to 6.9 | Still under the common adult goal. Where many people with well-managed diabetes sit. |
| 7.0 to 7.9 | Above the general goal. A conversation about where the highs are, not an emergency. |
| 8.0 and above | Where care teams usually act. Long stretches above range are hiding in the average. |
So a GMI of 6.0 or 6.4 sits comfortably inside the general goal and a GMI of 7.0 sits right on the line. Two cautions. First, the bands describe averages, so a 6.4 built on swings between 60 and 250 is a worse fortnight than a 6.8 that never left 100 to 180; that is why Time in Range is always printed beside GMI. Second, a GMI needs 14 days at roughly 70 percent sensor wear before it deserves any of these labels.
GMI to A1C: the formula and a quick chart
There is no conversion to do, because GMI is already expressed on the A1C scale: a GMI of 7.0 is meant to be read the way a lab A1C of 7.0 would be. What the CGM actually computes is this, from the 2018 paper that defined it: GMI (percent) = 3.31 + 0.02392 × mean glucose in mg/dL. Every 25 mg/dL of average glucose adds about 0.6 to the GMI.
| Mean glucose (mg/dL) | Mean glucose (mmol/L) | GMI |
|---|---|---|
| 100 | 5.6 | 5.7% |
| 120 | 6.7 | 6.2% |
| 140 | 7.8 | 6.7% |
| 154 | 8.5 | 7.0% |
| 180 | 10.0 | 7.6% |
| 200 | 11.1 | 8.1% |
| 250 | 13.9 | 9.3% |
For the opposite direction, from a lab A1C to the average glucose it implies, our A1C calculator does the arithmetic. How closely the two agree in real people is the next question.
| GMI | Lab A1C | |
|---|---|---|
| Data source | CGM sensor glucose | Blood draw in a lab |
| Time window | Usually the last 14 days | Roughly 2 to 3 months |
| What can skew it | Low sensor wear time, sensor bias | Red blood cell lifespan, anemia, pregnancy |
| Where you see it | Your CGM app or report | Your lab result |
Why do GMI and A1C disagree?
They disagree because they measure related but different things. In the trial data behind GMI, the two numbers were identical 19 percent of the time, differed by 0.3 points or more 51 percent of the time, and by half a point or more 28 percent of the time. Four reasons cover almost every case:
- Different time windows. A rough two weeks after a calm two months, or a good fortnight after a hard quarter, will split the numbers apart. GMI reacts fast; A1C lags.
- Individual biology. Some people’s red blood cells glycate more readily than average, and some less. That gives them an A1C that sits reliably above or below what their glucose average would predict.
- Thin CGM data. Missing readings, frequent gaps or low wear time tilt GMI toward whichever hours the sensor happened to capture.
- Margin of error on both sides. Lab assays vary. Sensors vary. Small differences stack.
So a 6.7% GMI beside a 7.1% A1C is not a contradiction that needs solving. What matters is whether the gap repeats. If your GMI runs half a point below your lab A1C at three visits in a row, say that out loud to your care team. That pattern changes how they read both numbers for you specifically.
GMI vs A1C: which number should you trust?
Trust them for different jobs. A1C is the validated lab standard your clinician tracks across years and uses when setting goals. GMI is the between-visits check that tells you which direction you are heading. Think of A1C as a photograph taken a few times a year and GMI as a live preview you can glance at whenever you want.
Used that way, they stop competing. If your GMI has drifted down over five or six weeks, your next A1C will probably follow. If it has climbed, you have weeks of warning instead of a surprise in an exam room. What GMI does not do is replace the blood test, and no consensus statement suggests it should. A1C still matters because long-term exposure is what the risk of diabetes complications has been measured against. Keep the labs your care team asks for.
GMI, A1C and Time in Range side by side
Both GMI and A1C flatten weeks of glucose into one figure, so both hide the swings. That is exactly the hole Time in Range fills. Time in Range reports the percentage of the day your glucose stays between 70 and 180 mg/dL (3.9 to 10.0 mmol/L), so it describes stability rather than an average.
The 2019 International Consensus on Time in Range suggests that many adults with type 1 or type 2 diabetes aim for at least 70% of the day in range, with under 4% below 70 mg/dL, while stressing that targets should be individualized. Pregnancy, older age and high hypoglycemia risk all shift the goalposts. Your own numbers belong to a conversation with your clinician.
Read all three together and the picture sharpens. GMI gives you the recent average, A1C anchors the long view, Time in Range shows how the days actually felt. Our guide to Time in Range walks through how the percentages are built and what the sub-metrics mean.
Frequently asked questions
Is GMI the same as estimated A1C (eA1C)?
Close, but the naming changed on purpose. GMI replaced “estimated A1C” in 2018 because the older term implied the CGM figure could predict a lab result. GMI describes what it really is: a percentage derived purely from sensor glucose. It is the current, preferred term.
Can you convert GMI to A1C?
There is nothing to convert: GMI is expressed on the A1C scale by design, so a GMI of 7.8 is meant to be read the way an A1C of 7.8 would be. What you cannot do is predict your lab result from it. In the data the formula was built on, 28 percent of people differed from their lab A1C by half a point or more.
How close is GMI to A1C?
Identical about one time in five, within 0.3 of a point about half the time, and half a point or more apart 28 percent of the time, in the trial data behind the formula. Close enough to steer by between visits, not close enough to skip the lab.
Is a GMI of 6.6 good?
For most adults with diabetes, yes: it sits under the general 7 percent goal the ADA gives for A1C. Whether it is good for you depends on the target you set with your care team and on what the average is hiding, so read it next to time below range. A 6.6 with almost no lows is a strong fortnight; a 6.6 bought with nightly dips is not.
Why is my GMI higher than my A1C?
Usually the mirror image of the lower case: your red blood cells glycate a little less than average, so the lab reads low against your sensor average, or the last two weeks were simply rougher than the last three months. Thin sensor data can also push GMI up if the sensor mostly captured your high hours. If the gap repeats at three visits, it is a feature of your biology worth telling your care team about.
My GMI is lower than my A1C. Is something wrong?
Plenty of people run a lab A1C higher than their glucose average would suggest, and the opposite happens too, often because of how their red blood cells behave or because of a condition that changes how long those cells live, kidney disease among them. So usually nothing is wrong. A repeating gap is worth showing your provider so goals can be set around your body rather than an average one.
How many days of CGM data does a reliable GMI need?
Fourteen days of wear with the sensor active roughly 70% of the time or more is the common benchmark. With less than that, GMI can swing noticeably from week to week. Gaps also matter more than people expect, since missing overnight hours can quietly move the average. Chase down missed readings; see our note on CGM readings versus finger sticks for how sensor accuracy plays in.
Watching the trend between lab visits
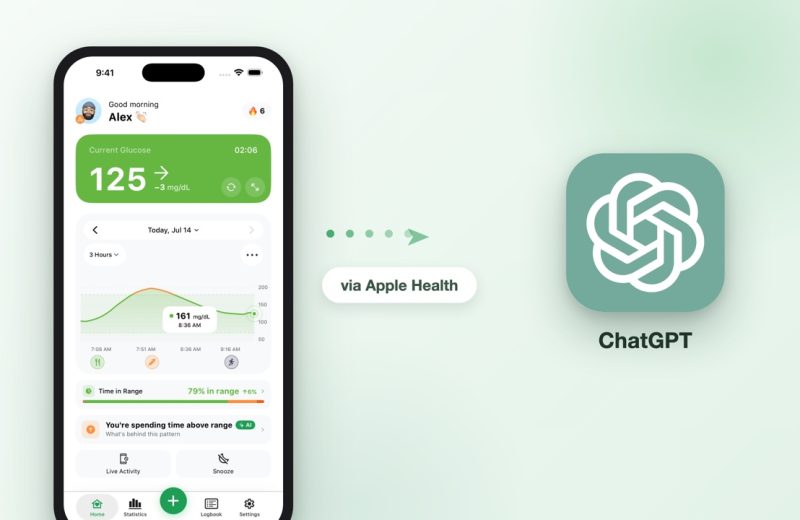
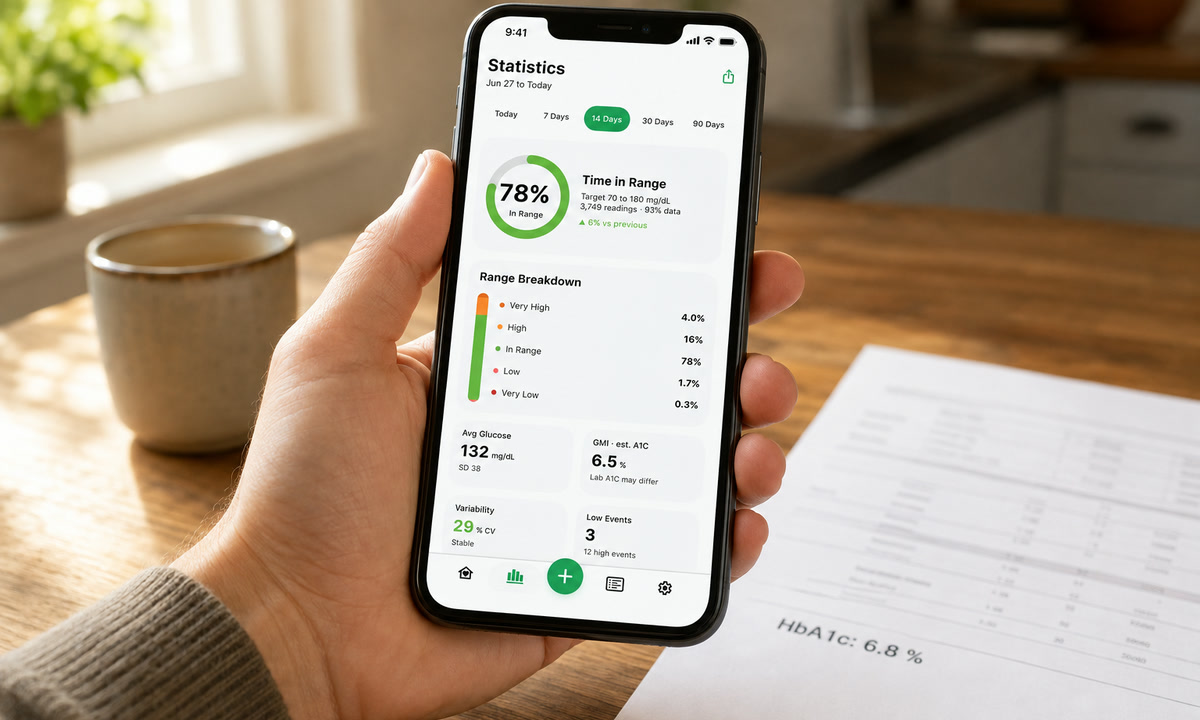
The point of GMI is early warning, and that only works if you look at your glucose data more often than twice a year. Sugar Sense keeps your live readings and your Time in Range on your iPhone and watch, so the direction you are heading is visible weeks before the blood draw confirms it. The Statistics screen also shows your GMI next to your average glucose, calculated with the same published formula, so the number this article is about is already on your phone.
Everything above is general education, not care advice for your situation. A companion app like Sugar Sense sits on top of your CGM and never takes the place of the sensor, its own alarms or a lab A1C. Set your targets, and any change to how you treat your diabetes, with the clinician who knows your history, and read our notes on medical use before relying on anything here.